
Master Power BI & Build Professional Dashboards with Confidence
Learn how to transform raw data into interactive dashboards and actionable insights using Microsoft Power BI. This practical, beginner-friendly course takes you from data preparation to professional reporting in 14 Days.

Why This Course?
Most Power BI courses teach you how to use the software. This course teaches you how to use Power BI to solve real-world business problems.
You won't spend the entire course simply creating charts and following step-by-step tutorials. You'll learn how to take raw, messy data and turn it into professional dashboards that communicate meaningful insights.
You'll Learn How To:
- Import and connect data from multiple sources
- Clean and transform data with Power Query
- Build effective data models
- Create powerful DAX calculations
- Design interactive, professional dashboards
- Analyze trends, performance, and KPIs
- Turn data into clear business insights
- Create reports that decision-makers can actually use
By the End of the Course, You'll Be Able To:
- Build professional Power BI dashboards
- Transform raw data into analysis-ready datasets
- Create calculated measures using DAX
- Build relationships between multiple data sources
- Analyze business performance and trends
- Present insights through interactive reports
- Publish and share reports using Power BI Service
- Build a portfolio project you can showcase to employers
- Apply your Power BI skills to real-world data analytics projects
You'll Gain Skills In:
Power BI • Power Query • DAX • Data Modeling • Data Transformation • Data Visualization • Data Analysis • Data Storytelling • KPI Development • Dashboard Design • Business Intelligence • Executive Reporting • Power BI Service
Don't Just Learn Power BI.
Learn how to use Power BI to turn data into insights, insights into decisions, and your skills into career opportunities.
JOIN WAITLISTMeet Your Instructor
Learn Power BI from Clement Boateng, an Analytics Consultant, Power BI Developer, and Project Management Professional with extensive experience in Data Analytics, Business Intelligence, and Project Controls Reporting. Clement has worked extensively with Power BI, Microsoft Fabric, Power Query, and DAX, helping organizations turn complex data into meaningful insights and executive-level reports. As an experienced project controls, data professional and educator, he brings real-world analytics experience into the classroom, focusing on practical skills, hands-on projects, and the techniques professionals use to build effective Power BI solutions.

WHAT OUR STUDENTS ARE SAYING
WHAT YOU WILL LEARN
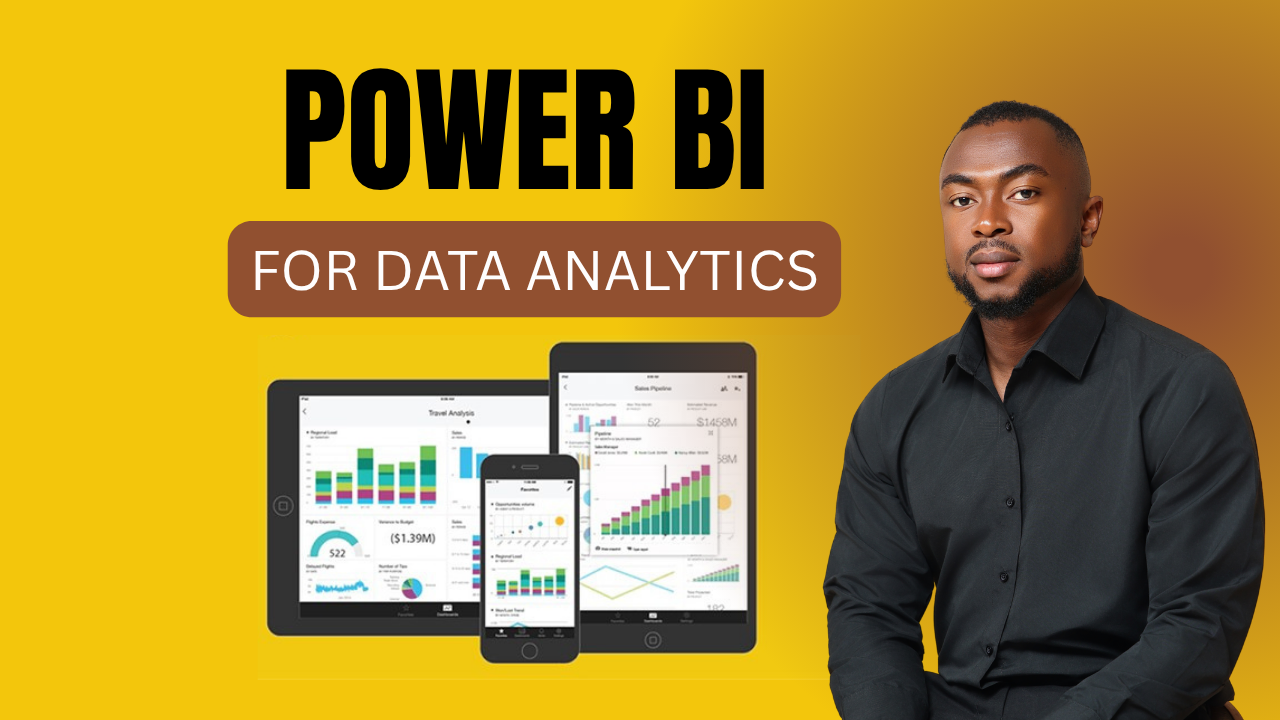
POWER BI FOR DATA ANALYTICS & VISUALIZATION: Beginner to Advanced
-
DAY 1. COURSE INTRODUCTION
7 lessons- 1.1: Welcome
- 1.2: Course Navigation
- 1.3: Power BI for Business Intelligence in Different Domains
- 1.4: The Data Analyst Mindset & Visualization Process
- 1.6: Sourcing High-Quality Data (Kaggle & Data.gov)
- 1.7: Build Your First Dashboard
- Day 1 Quiz
-
DAY 2: SOURCING & CONNECTING PROJECT DATA
1 lesson- 2.1: Day 2 Intro.
-
DAY 3: DATA CONNECTION
9 lessons- 3.1: Intro to Data Sourcing and Connection
- 3.2: Connecting to Flat Files (Excel & CSV)
- 3.3: Folder & SharePoint Connections
- 3.4: Connecting to SQL Databases
- 3.5: Data Structure & Storage (Cloud vs. On-Premises)
- 3.6: Web, API, Fabric & Dataflow Connections
- 3.7: Changing Data Sources (Excel vs. CSV)
- Day 2 Quiz
- 2.0: Intro to Data Connection
-
DAY 4: INTRODUCTION TO DATA TRANSFORMATION IN POWER QUERY
8 lessons- 4.1: Intro to Data Transformation
- 4.2: Intro to Power Query
- 4.3: Working with Data Types
- 4.4: Visual Data Profiling Tools
- 4.5: Row Transformations & Header Fixes
- 4.6: Filtering and Sorting Data
- 4.7: Managing Blanks, Duplicates & Errors
- DAY 3 QUIZ
-
DAY 5: COLUMN TRANSFORMATIONS & LOADING
8 lessons- 5.1: Managing and Removing Columns
- 5.2: Text Manipulations (Split, Merge, Extract)
- 5.3: Formatting Text (Rename, Trim & Clean)
- 5.4: Grouping Data (Summarization)
- 5.5: Pivoting Columns
- 5.6: Unpivoting Columns
- 5.7: Duplicate vs. Reference Queries
- 5.8: Loading Data into Data Model
-
DAY 6: COLUMN GENERATION IN POWER QUERY
5 lessons- 6.1: Generating Columns via the Text, Number, and Date Menus
- 6.2: Transforming Data via Column Statistics
- 6.3: Creating Custom Columns
- Lesson 6.4: Creating Conditional Columns
- 6.5: Using Column from Examples
-
DAY 7: INTEGRATING DATA TABLES
4 lessons- 7.1: Intro to Data Integration
- 7.2: Appending Queries (Stacking Data)
- 7.3: Merging Queries (Joining Data)
- DAY 3 QUIZ
-
DAY 8: DAX (DATA ANALYSIS EXPRESSIONS)
9 lessons- 8.1: Introduction to DAX Syntax
- 8.2: Calculated Columns vs. Measures
- 8.3: Standard Mathematical Aggregators (SUM, AVERAGE, COUNT)
- 8.4: Conditional Logic via IF and SWITCH
- 8.5: Mastering the CALCULATE Function
- 8.6: Overriding Filters via ALL and ALLEXCEPT
- 8.7: Introduction to Time Intelligence Functions
- 8.8: Leveraging AI to Write and Debug DAX Measures
- DAY 5 QUIZ
-
DAY 9: DATA MODELING IN POWER BI
8 lessons- 9.1: Introduction to Data Modeling & Schemas
- 9.2: Primary Keys vs. Foreign Keys
- 9.3: Fact Tables vs. Dimension Tables
- 9.4: Cross Filter Direction (Single vs. Both)
- 9.5: Understanding Relationship Cardinality
- 9.6: The Star Schema vs. The Snowflake Schema
- 9.7: Active vs. Inactive Relationships
- DAY 4 QUIZ
-
DAY 10: DATA VISUALIZATION
3 lessons- 10.1: Intro to Data Visualization
- 10.2: Selecting the Right Visual
- 10.3: Selecting more visuals via the Power BI Marketplace
-
DAY 11: DASHBOARD FORMATTING & STYLING
6 lessons- 11.1: Visual Formatting vs. General Properties
- 11.2: Perfecting Titles, Labels, Axes, and Legends
- 11.3: Themes, Colors, and Conditional Formatting
- 11.4: Customizing Tooltips
- 11.5: Understanding the 3 Filter Scopes
- 11.6: Designing Interactive Slicers
-
DAY 12: ADVANCED VISUALIZATION & DATA STORYTELLING
5 lessons- 12.1: Page Navigation & Syncing Slicers
- 12.2: Implementing Drill Downs & Drill Throughs
- 12.3: Mastering Bookmarks & Buttons
- 12.4: Principles of Data Storytelling
- DAY 6 QUIZ
-
DAY 13: POWER BI SERVICE & CLOUD DISTRIBUTION
10 lessons- 13.1: Sharing Reports to End Users - Make this a video intro video
- 13.2: Introduction to Power BI Service Architecture
- 13.3: Publishing Reports to Workspaces
- 13.6: Configuring Scheduled Data Refreshes
- 13.5: Introduction to Data Gateways
- 13.8: Secure Direct Sharing and Report Exports
- 13.7: Enterprise Distribution via Power BI Apps
- 13.9: Implementing Static Row-Level Security (RLS)
- 13.4: Creating and Curating Dashboards
- DAY 7 QUIZ
-
DAY 14 TO DAY 8: PACKAGING YOUR PORTFOLIO & CAREER READINESS
4 lessons- 14.0 Video - What next after this - Talk about how they should connect the report
- 14.1: High-Impact Resume Optimization for Analytics Roles
- 14.2: Interview Mastery & Setting Yourself Up for Success
- 14.3: Publishing to Web & Interactive Embedding
What You'll Build Throughout the Course
Build interactive Power BI dashboards that turn raw data into powerful insights, helping you uncover trends, track performance, and make better business decisions.
Why Students Choose This Course
Learn With Real-World Data
Work with realistic business datasets instead of only following simple tutorial examples.
Build Portfolio Dashboards
Create professional, interactive dashboards that you can showcase on your resume, LinkedIn, portfolio, or in job interviews.
Learn by Doing
Every lesson includes hands-on exercises, giving you practical experience rather than just watching videos.